
Article by CryptoJelleNL
While many new traders rely exclusively on technical analysis to make trading decisions, a large group of more experienced traders frequently looks to on-chain data to add confidence to their trading ideas, or to generate new trading ideas.
This type of analysis is unique to crypto – but you can probably best compare it to studying the annual reports of a publicly traded company before investing in their stock. In essence, because blockchains are publicly accessible and visible, they allow users to access a bunch of data that would not be accessible in the traditional banking infrastructure. As such, anyone can quickly look up the crypto-wealth of Justin Sun, but it'll be much harder to accurately find the numbers he finds on his bank statements.
And it goes much further than that – you can analyze patterns in transactions, the movement of funds, trends in the market, and the adoption of new tools, just to name a few. These days, multiple high-quality tools exist to gather, analyze, and visualize on-chain data in simple ways, allowing individual traders to have access to the same information that the big-pocketed trading funds have.
Let's dive into everything On-chain analysis has to offer
What is on-chain analysis?
On-chain analysis is the practice of using blockchain data to derive trading insights. Analysts access the vast amounts of data stored on the blockchain to generate insights, find investment opportunities, and forecast future price movements and market sentiment.
Over the years, many different tools and techniques have been developed to serve a wide range of purposes, but most of them involve extracting specific bits of information, and displaying that information in a chart – to easily visualize a given trend.
The strong advantage of on-chain analysis is that it is purely factual data. For example, if the transaction volumes and active wallets on Solana are rising, you can state with confidence that Solana's adoption is growing.
Nevertheless, a lot of on-chain analysis requires interpretation. Consider the following: you're monitoring large Bitcoin transactions, and you see major withdrawals from Binance to decentralized wallets. While you can probably assume these coins will not hit the market anytime soon, you can never be too sure. In fact, in some cases, the coins are re-deposited to another exchange (let's say Kraken), just hours later.
As such, you should be careful not to rush to conclusions, as some players like to fool on-chain analysts by making certain moves on purpose. Smoke and mirrors!
Basic on-chain analysis
Beginner analysts can venture into the world of on-chain analysis by simply firing up a blockchain explorer. While the on-chain analysis may sound complex and daunting, it can be as easy as monitoring the home page of Etherscan to see if transaction volumes are going up, or down. Another popular basic approach is to monitor the transactions of a specific wallet. The wallet of a popular on-chain trader, for example.
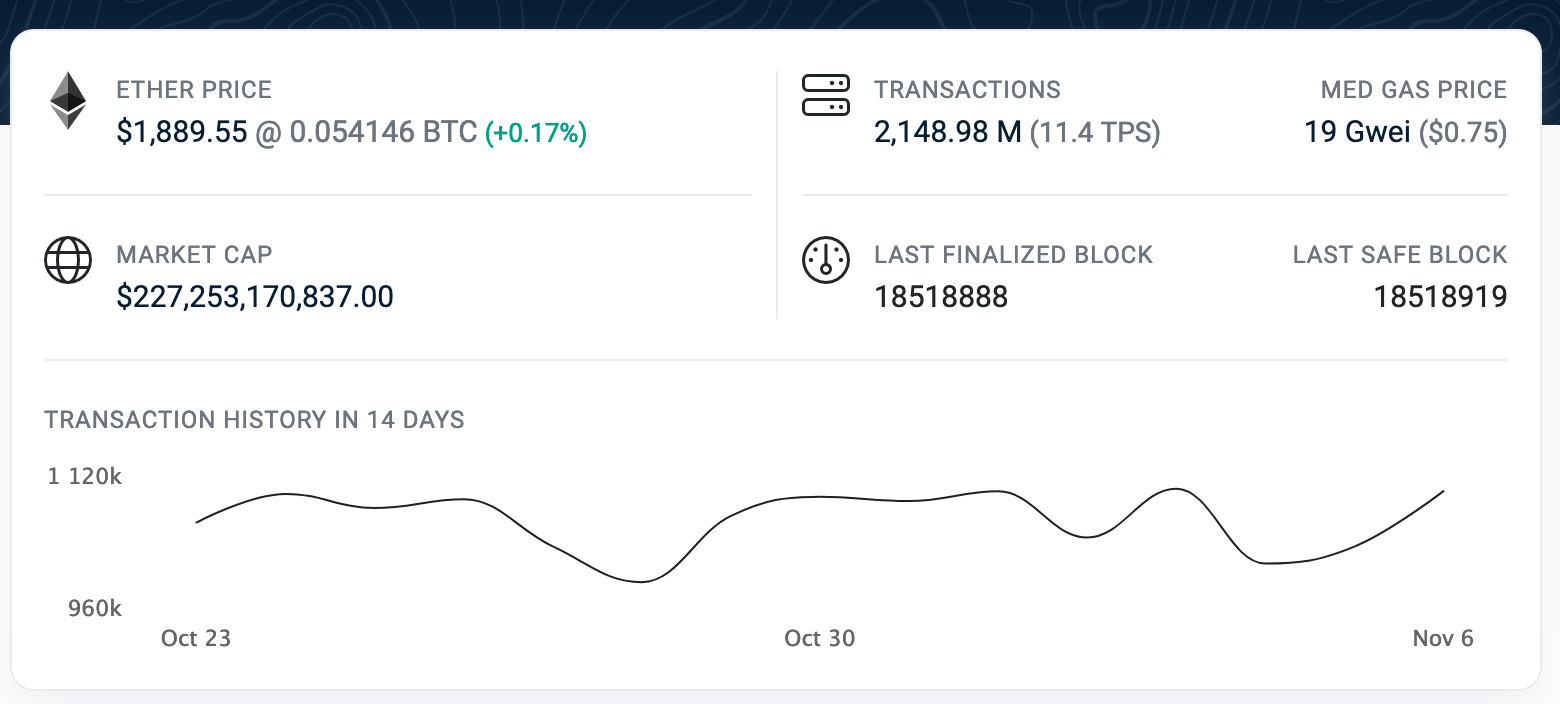
Blockchain Explorers are a popular tool in cryptocurrency analysis that allows you to access live information about transactions, wallets, and blocks on a specific blockchain.
More complex on-chain analysis
Naturally, most traders eventually want to grow beyond the simplest form of analysis – and they look for a more sophisticated way of using the vast amounts of data out there. Different analytics platforms can help these users gather insights into transaction patterns, network health, tokenomics, and market trends, more so than a basic blockchain explorer can.
For example, on-chain analysis can feed into a broad fundamental analysis of a given token. On-chain analysis provides insights into the distribution of tokens among of the number of holders a token has, its trading volumes, and more – adding on to an analysis of the project's whitepaper & community.
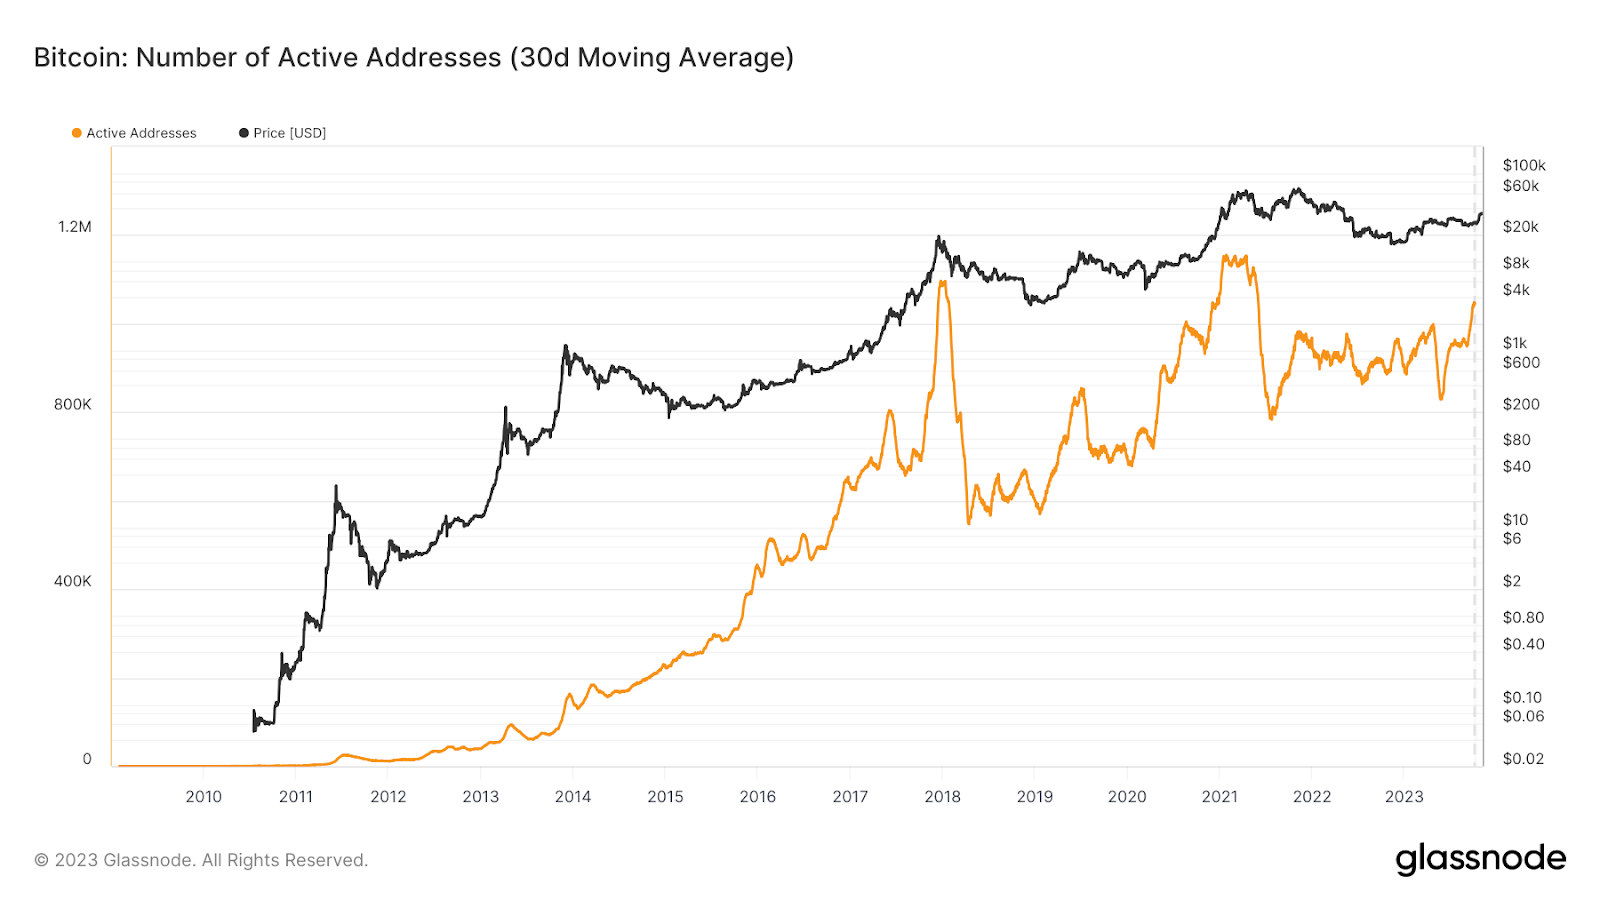
The below chart (taken from Glassnode, a popular on-chain analysis platform) shows the number of active Bitcoin wallet addresses over the past 13 years. As Bitcoin's active user base grew, so did the price. You can also clearly see the user base skyrocket around the heights of the 2017 bull market, a tell-tale sign of FOMO-fuelled activity.
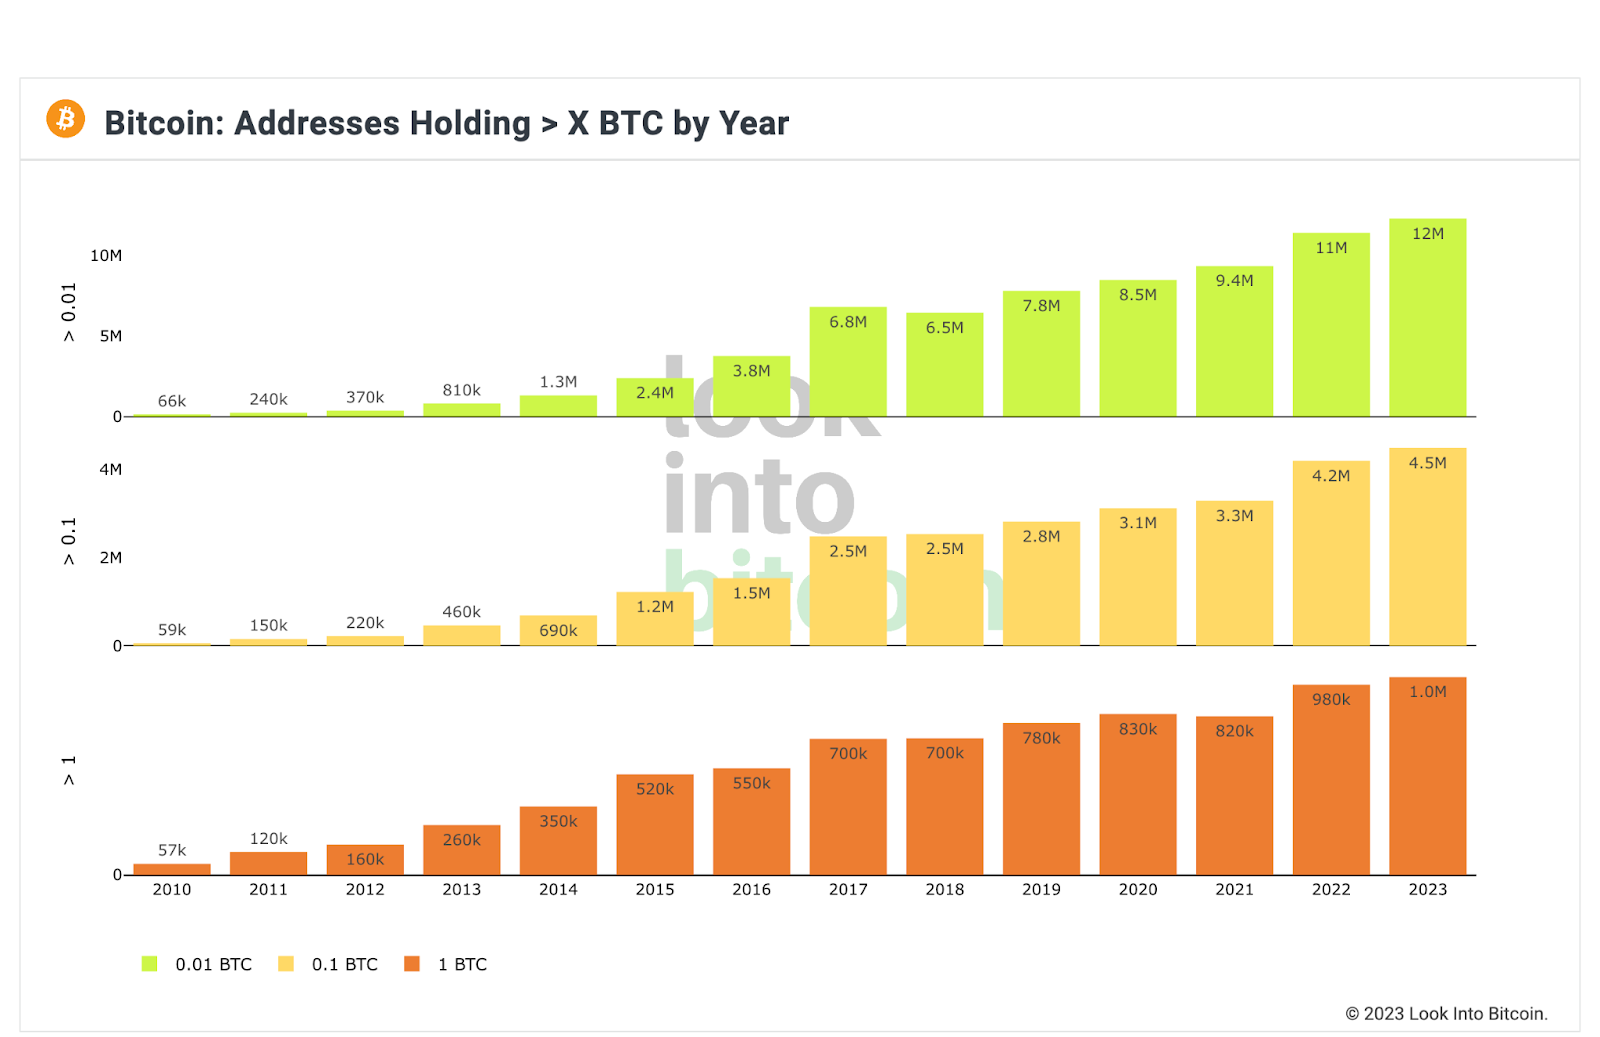
While the number of active addresses includes accounts with just a couple of sats, LookIntoBitcoin's Addresses Holding >X BTC Dashboard can yield further insight into the rapid accumulation of Bitcoin.
Platforms such as Dune Analytics allow an even closer look under the hood of a specific project. The screengrab below is just a portion of WooFi's WOO Staking Dashboard on dune, which shows you everything from the average APR on staking, to the biggest WOO-staking whales.
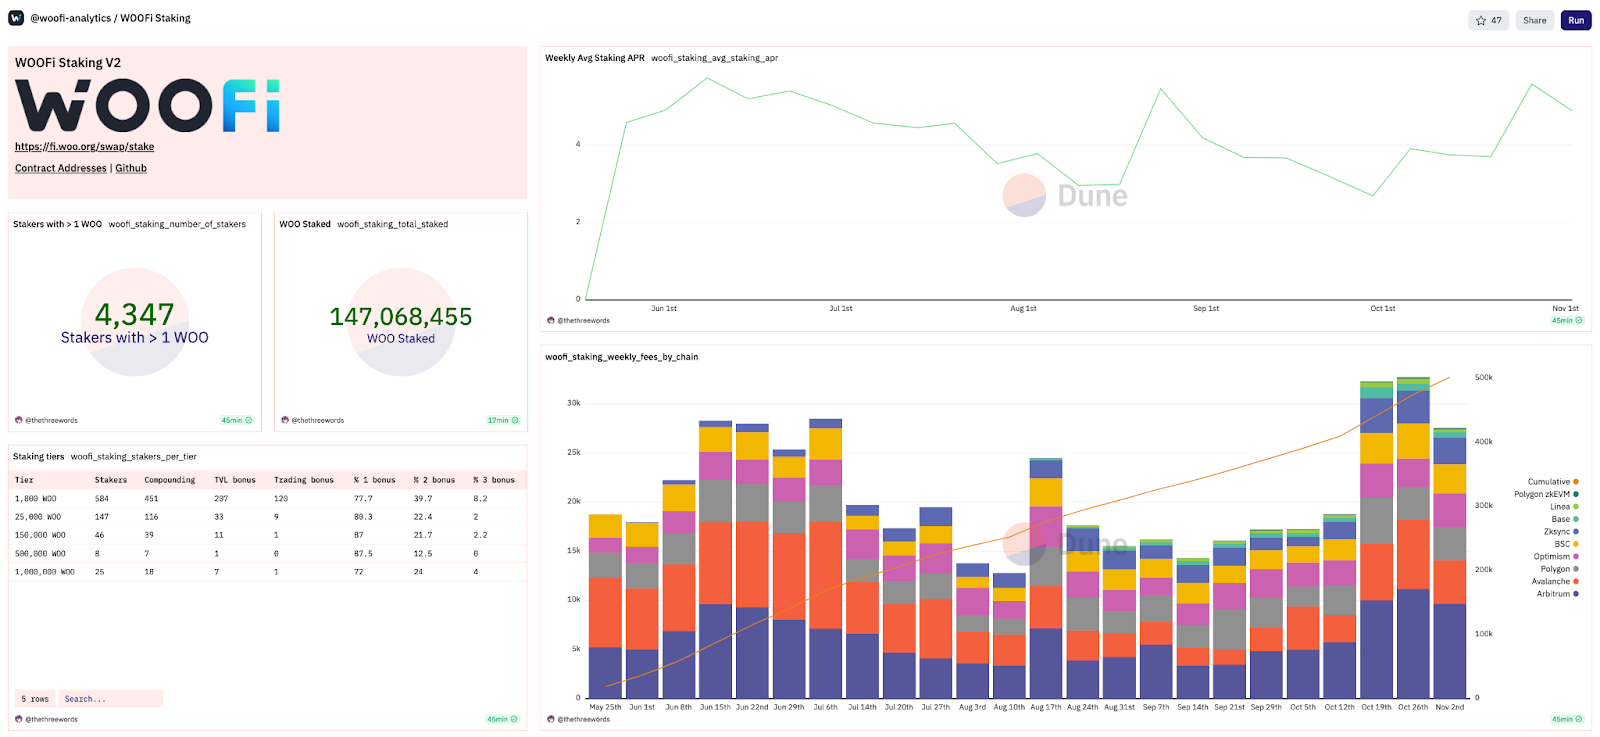
Dune is an especially useful platform because it is (1) free to use and (2) contributor-ran. Anyone can make a dashboard if they want to, and they can then share that dashboard with the world.
Closing thoughts
All in all, on-chain analysis is a powerful tool that can be a great addition to your trading toolbox. The platforms we discussed in this article offer many more tools and dashboards – something definitely worth checking out.
As with any form of analysis, keep in mind that on-chain analysis can give you misleading signals, so don't blindly make trading decisions based on on-chain metrics alone.
Author's Disclaimer: This article is based on my limited knowledge and experience. It has been written for informational purposes only. It should not be construed as trading or investment advice in any shape or form.
Editor's note: CryptoJelleNL provides insights into the cryptocurrency industry. He has been actively participating in financial markets for over 5 years, primarily focusing on long-term investments in both the stock market and crypto. While he watches the returns of those investments roll in, he writes articles for multiple platforms. From now on, he will be contributing his insights for WOO as well.
Check out his twitter: twitter.com/cryptojellenl
—
The content above is neither a recommendation for investment and trading strategies nor does it constitute an investment offer, solicitation, or recommendation of any product or service. The content is for informational sharing purposes only. Anyone who makes or changes the investment decision based on the content shall undertake the result or loss by himself/herself.
The content of this document has been translated into different languages and shared throughout different platforms. In case of any discrepancy or inconsistency between different posts caused by mistranslations, the English version on our official website shall prevail.